The Levant Moves South, 1750–1829
 View full map
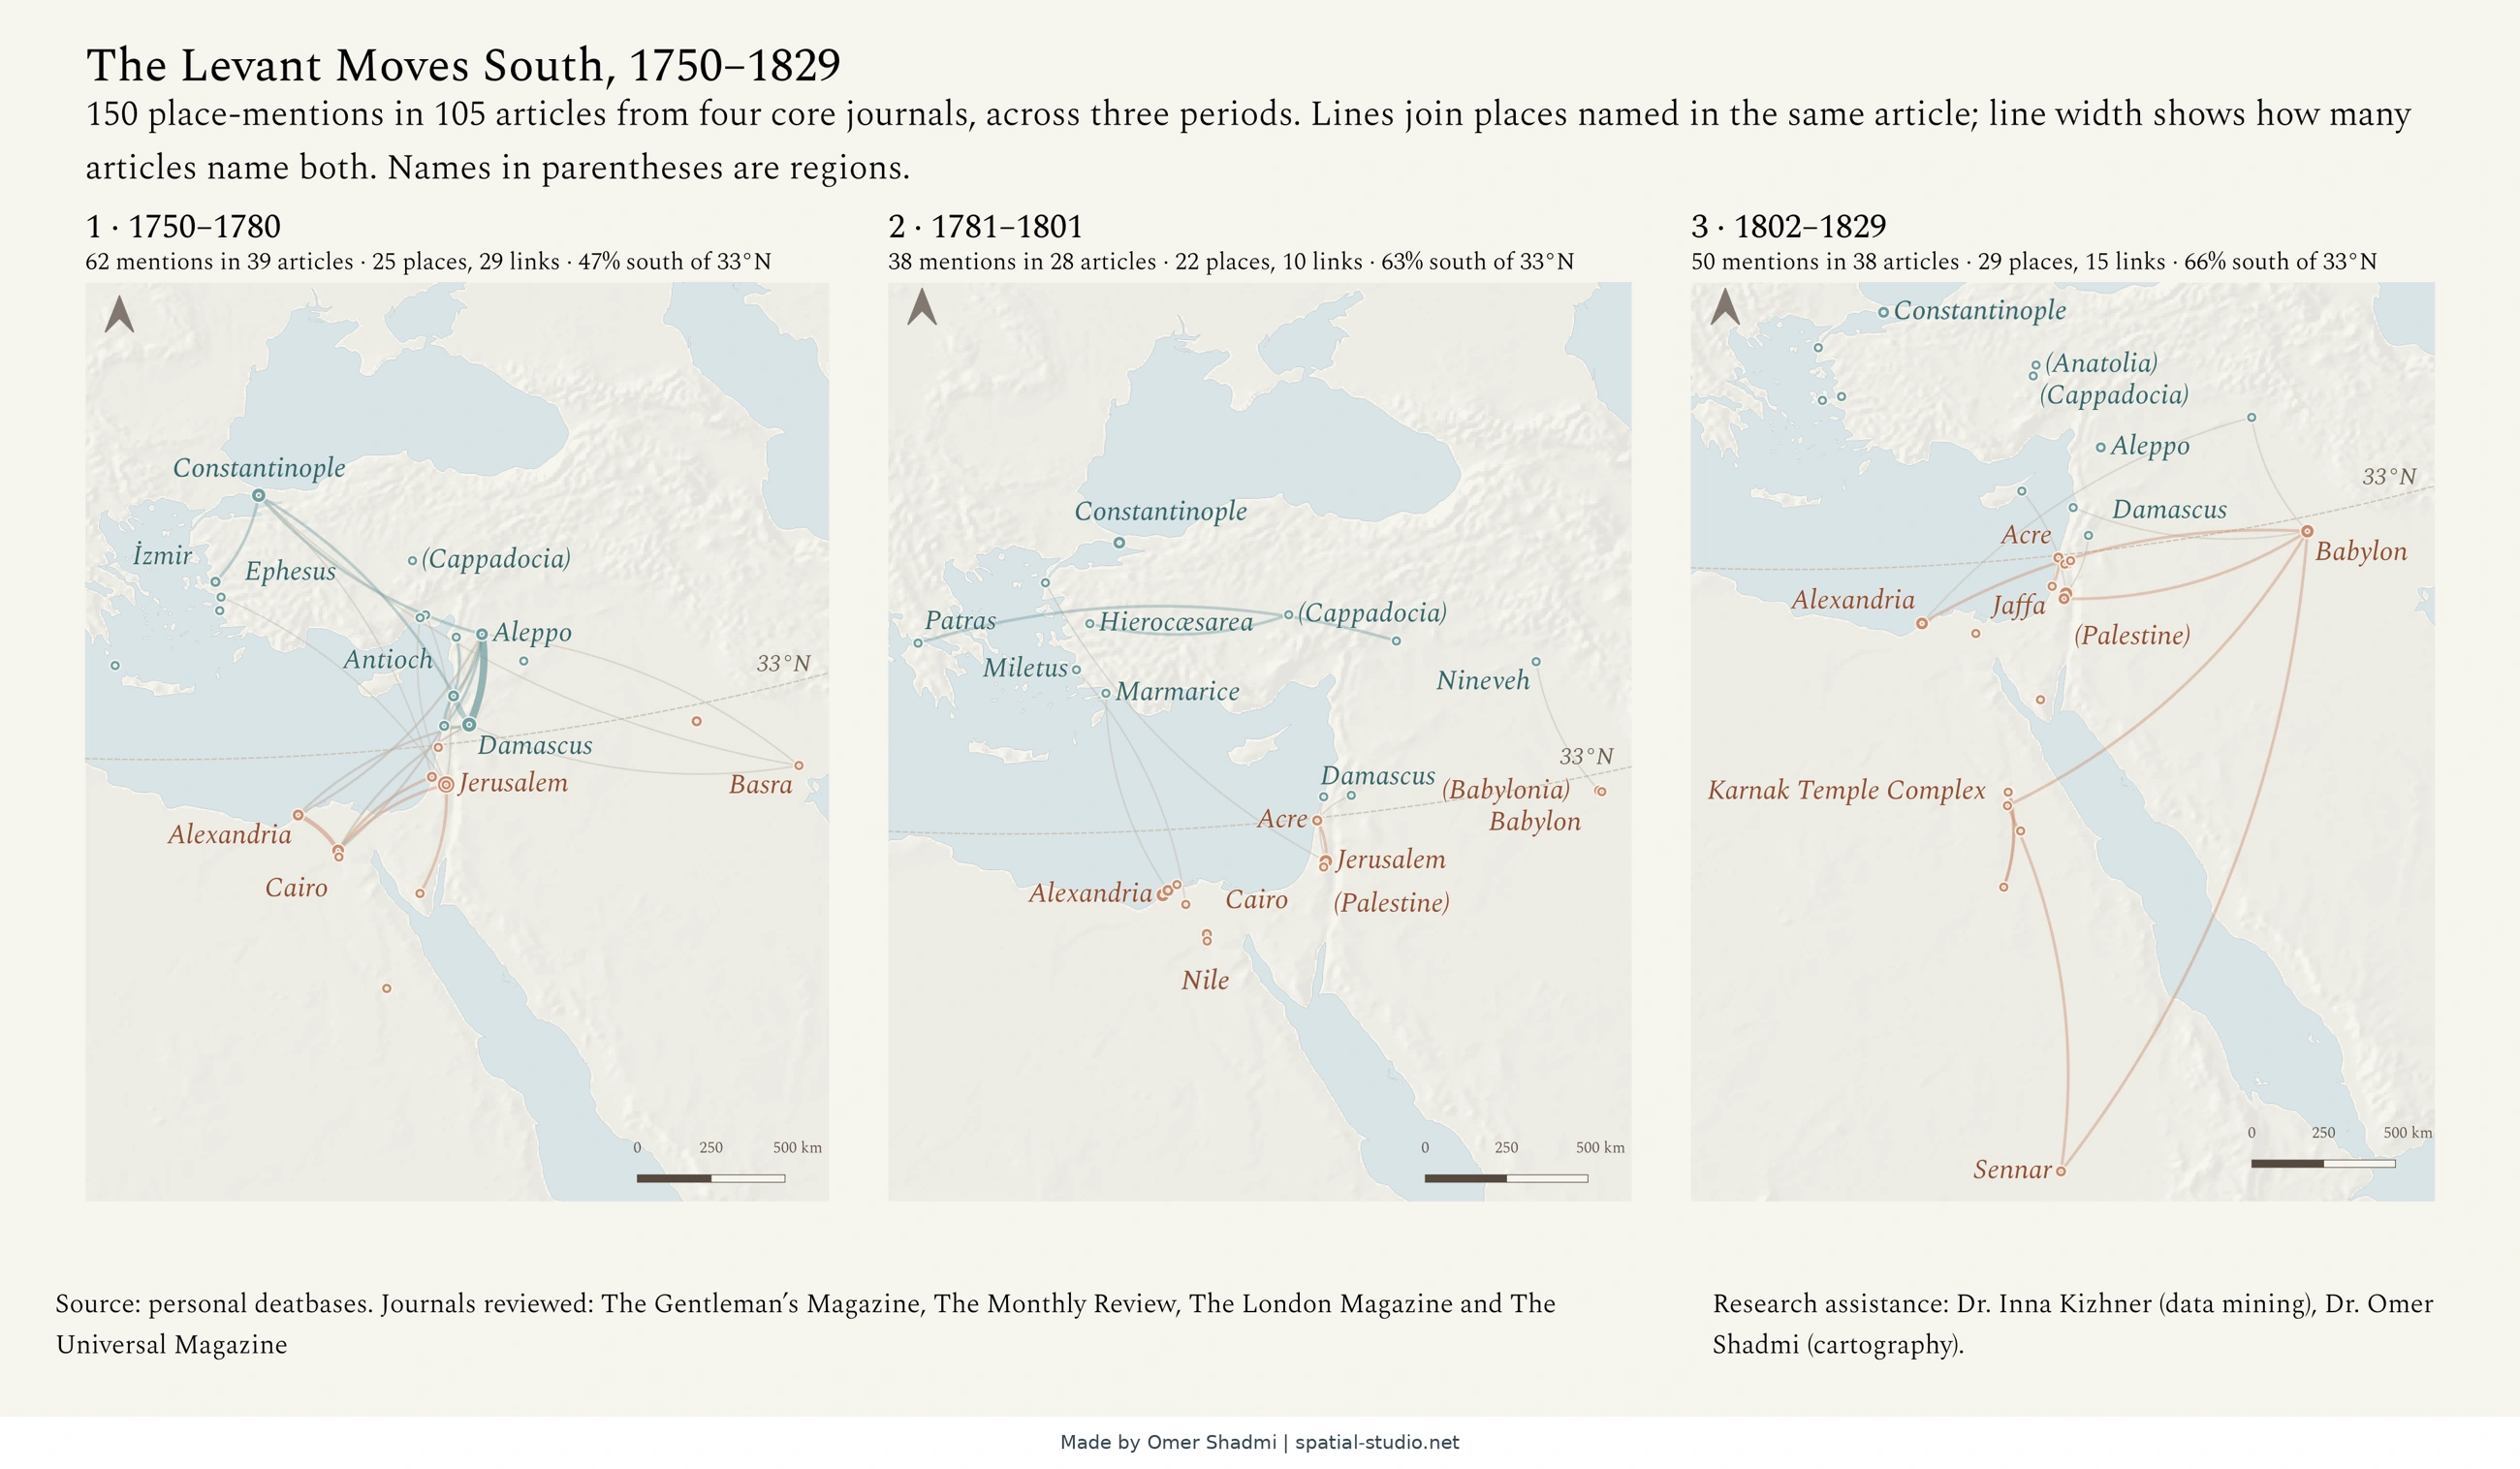
This map shows how the places British periodicals wrote about in the Levant changed between 1750 and 1829. It has three panels, one for each period. Rings mark the places named, and lines join places named in the same article. In each period, a larger share of the mentions falls south of 33°N.
How this map was created
The Levant Moves South, 1750–1829
The Spatial Studio – Omer Shadmi · spatial-studio.net
This file was created in retrospect using documentations of the workflow
General information
This map shows how the places British periodicals wrote about in the Levant changed between 1750 and 1829. It has three panels, one for each period. Rings mark the places named, and lines join places named in the same article. In each period, a larger share of the mentions falls south of 33°N.
Map title | The Levant Moves South, 1750–1829 |
Author | Omer Shadmi |
Owner | Zoe Beenstock |
Publication date / version | Version 1 (publication date to be added) |
Geographic coverage | The Levant and neighbouring regions: from Constantinople and the Aegean in the north to Upper Egypt and Sennar in the south, and from Egypt to Basra in the east |
CRS | Lambert azimuthal equal-area, centred on 38°N, 25°E (+proj=laea +lat_0=38 +lon_0=25 +x_0=0 +y_0=0 +datum=WGS84 +units=m); no EPSG code |
Dimensions | Three panels of 99.9 × 123.5 mm each |
Map file | Zoe m1.png |
Software | QGIS 3.40; Claude (Anthropic); Kepler.gl (data exploration) |
Documentation date / method | 29 October 2026. Written in retrospect from the project files and the records of the Claude conversations. Documented by The Spatial Studio (spatial-studio.net) |
Permanent link | https://spatial-studio.net/maps/the-levant-moves-south/ |
Suggested citation
Please consult the owner, Zoe Beenstock, for how to cite this map.
How this map was created
Stage | What was done | AI / Human |
1. | Dataset of mentions of the Levant in a list of British periodicals by keywords | Human (Inna Kizhner) |
2. | Creating a spatialized dataset of places included in the original dataset: geocoding the database by automated reconciliation with Wikidata and other datasets with constant review and decisions making about what places to include, right reconciliation, and right names to use. | Human (Omer Shadmi, Zoe Beenstock) |
3. | Visualizing the spatialized database using Kepler.gl | Human (Omer Shadmi) |
4. | Exploring insights in the visualization | Human (Zoe and Omer) |
5. | An AI agent created by Zoe to search for insights in Kepler. | AI (Claude) |
6. | Exploration of important insights using Claude and in dialogue with Omer. Three different maps were chosen for production | Humans (Zoe) |
7. | Creation of map drafts by Zoe’s Claude | AI (Claude) |
8 | Omer sent Zoe a prompt to produce a QGIS project he can design. | Human (Omer) |
9 | Zoe’s Claude produced a QGIS project | AI (Claude) |
10 | Review of the AI-generated QGIS project for CRS, locations, layers sources, labels, and data | Human |
11 | Design rounds using a Claude skill Omer created: options for the basemap (colour, relief, sea texture), fonts and symbols, shown on all three maps, while the data is locked. After each round Omer chose and refined the options. | AI (Claude) generates options; Human (Omer) selects |
12 | Change of CRS from an equirectangular projection (true scale at 31°N, as in the creator’s figure) to a Lambert azimuthal equal-area projection centred on 38°N, 25°E, used for all three maps. Claude proposed it and rendered both versions for comparison; Omer chose it. | AI (Claude) proposes and renders; Human (Omer) decides |
13 | Further design rounds, including five options for making the links between places easier to read (line weight, opacity, colour, dashes and dot size). Omer asked for a calmer, lighter look. | AI (Claude) generates options; Human (Omer) selects and gives feedback |
14 | Applying a list of corrections to the dataset: about 16 decisions on place names and coordinates, taken one at a time (for example Bassora to Basra, Istanbul to Constantinople). A change log was kept for Zoe. | AI (Claude) proposes and logs; Human (Omer) decides |
15 | Building the M1 QGIS project from the corrected dataset, based on the M0 project: a 16:9 slide with three panels, and a scale bar and north arrow in each. Claude fixed a projection error and a rendering problem during the build. | AI (Claude) |
16 | Opening the project in QGIS and reporting problems: only two of the three panels showed, and labels were too faint and small. Claude fixed both. | Human (Omer) reports; AI (Claude) fixes |
17 | Fitting each panel to its own period’s places, and placing labels with a custom program so that labels do not overlap each other, rings, links, scale bars or north arrows. Nothing else was changed. | AI (Claude), at Omer’s request |
18 | Fine-tuning in QGIS following Claude’s step-by-step instructions: deleting some labels, fixing a line style that was too thin, colouring region names by north or south, removing the brackets from “Nile” and adding a Red Sea label. Claude also checked that the subtitle describes line width correctly. | Human (Omer), guided by AI (Claude) |
19 | Recording the sources and licences of the data and fonts in the project README. | AI (Claude) |
Data sources
Data | Source |
Places and other data | Researcher’s dataset of place-mentions in four British periodicals, 1750–1829: The Gentleman’s Magazine, The Monthly Review, The London Magazine and The Universal Magazine. Data mining: Dr. Inna Kizhner. |
Land and sea polygons | Natural Earth 1:50m (public domain) |
License
This map belongs to Zoe Beenstock. Any use of it requires her approval. Requests can be made through The Spatial Studio (spatial-studio.net).
Version history
Version 1: first version of the map (date to be added).
Cite this map
Shadmi, Omer. (n.d.). The Levant Moves South, 1750–1829 [Map]. The Spatial Studio. https://spatial-studio.net/maps/the-levant-moves-south/
The documentation requests consultation with Zoe Beenstock about citation and permission to use the map. This reference identifies the displayed map; it does not grant permission to reuse it.
License
This map belongs to Zoe Beenstock. Any use of it requires her approval. Requests can be made through The Spatial Studio (spatial-studio.net).
Permanent link: https://spatial-studio.net/maps/the-levant-moves-south/